|
| The probability of a correct classification. | (1 – Error) = Pr(C) = | (TP + TN) |
|
|
| (PP + NP) |
| Specificity | The ability of the test to correctly rule out the disease in a disease-free population. | Specificity = | TN |
|
|
| (TN + FP) |
| Logarithmic Loss | Logarithmic Loss or Log Loss, works by penalising false positives. It works well for multi-class classification. When working with Log Loss, the classifier must assign probability to each class for all the samples.
Suppose, there are N samples belonging to M classes, then the Log Loss is calculated: |
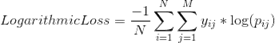 Image Modified Image Modified
| where,
y_ij, indicates whether sample i belongs to class j or not
p_ij, indicates the probability of sample i belonging to class j
Log Loss has no upper bound and it exists on the range [0, ∞). Log Loss nearer to 0 indicates higher accuracy, whereas if the Log Loss is away from 0 then it indicates lower accuracy. In general, minimizing Log Loss gives greater accuracy for the classifier. |
| Area Under Curve | Area Under Curve(AUC) is one of the most widely used metrics for evaluation. It is used for binary classification problem. AUC of a classifier is equal to the probability that the classifier will rank a randomly chosen positive example higher than a randomly chosen negative example. Before defining AUC, let us understand two basic terms :
True Positive Rate (Sensitivity) : True Positive Rate is defined as TP/ (FN+TP). True Positive Rate corresponds to the proportion of positive data points that are correctly considered as positive, with respect to all positive data points.
False Positive Rate (Specificity) : False Positive Rate is defined as FP / (FP+TN). False Positive Rate corresponds to the proportion of negative data points that are mistakenly considered as positive, with respect to all negative data points.
False Positive Rate and True Positive Rate both have values in the range [0, 1]. FPR and TPR bot hare computed at threshold values such as (0.00, 0.02, 0.04, …., 1.00) and a graph is drawn. AUC is the area under the curve of plot False Positive Rate vs True Positive Rate at different points in [0, 1].
As evident, AUC has a range of [0, 1]. The greater the value, the better is the performance of our model. | 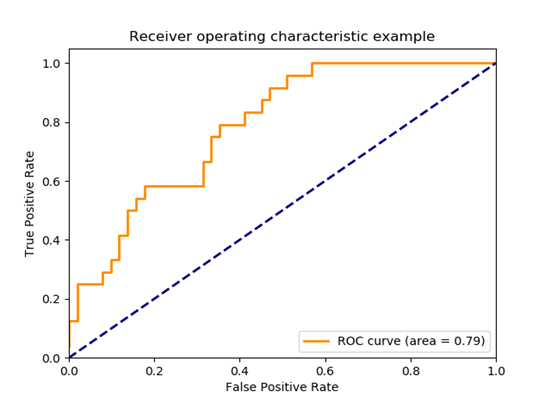 Image Modified Image Modified
|
|
| Mean Absolute Error | Mean Absolute Error is the average of the difference between the Original Values and the Predicted Values. It gives us the measure of how far the predictions were from the actual output. However, they don’t gives us any idea of the direction of the error i.e. whether we are under predicting the data or over predicting the data. Mathematically, it is represented as : | 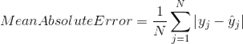 Image Modified Image Modified
| |
|
| Mean Squared Error | Mean Squared Error(MSE) is quite similar to Mean Absolute Error, the only difference being that MSE takes the average of the square of the difference between the original values and the predicted values. The advantage of MSE being that it is easier to compute the gradient, whereas Mean Absolute Error requires complicated linear programming tools to compute the gradient. As, we take square of the error, the effect of larger errors become more pronounced then smaller error, hence the model can now focus more on the larger errors. | 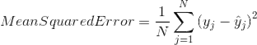 Image Modified Image Modified
| |
|