| METRICS / KEY PERFORMANCE INDICATORS FOR MATCHING |
| HIMSS developed a set of key performance indicators (KPIs) that allow an organization to evaluate its patient matching processes and technology and make continuous improvements. |
| Metric | Definition | Calculation | Numerator | Denominator |
| EMPI Database Activity Rate (EDAR) | This rate provides the relative activity of the database. It provides the ratio of the total number of EMPI algorithm matching evaluations (TEM) performed in a given timeframe to the overall size of the EMPI database (EDS). | EDAR = | Total EMPI Matches (TEM) x 100
EMPI Database Size (EDS) | Total EMPI Matches (TEM): The total number of potential pair candidates presented by the EMPI algorithm for a given period of time. A computer generated duplicate report will identify the number of candidate pairs for matches based on the algorithm rules or thresholds. | EMPI Database Size (EDS): The total number of records or lines stored in the database. This includes individual categories such as unique individuals, duplicates, personnel listings for security access control, quality control names, pseudo names, test names, un-reconciled records, and abandoned registrations, among others. |
| EMPI Database Duplicate Rate (EDDR) | This is the percent of paired records in the database that are potential duplicates or multiples. This measure reports a duplicate rate prior to research and validation of the records paired by the algorithm. It is commonly referred to as the Database Duplicate Rate, Duplicate Percentage or sometimes Pair Rate. | EDDR = | EMPI Database Duplicates (EDD) x 100
EMPI Database Size (EDS) | EMPI Database Duplicates (EDD): The numeric count of records that are potential duplicates within the database. The EDD is calculated by subtracting the EPP (unduplicated person count in the database) from the EDS (total lines in database). | EMPI Database Size (EDS): The total number of records or lines stored in the database. This includes individual categories such as unique individuals, duplicates, personnel listings for security access control, quality control names, pseudo names, test names, un-reconciled records, and abandoned registrations, among others. |
| Duplicate Creation Rate (DCR) | This is the ratio of newly created duplicate records (numerator) to the opportunity to create a duplicate through various encounters with patients (denominator) in a given period of time. Opportunities to create duplicates would include scheduling events, registration, preregistration, office visits, among others. Denominators may vary by organization depending on the registration and scheduling solutions employed. The total number of individual duplicate patient records is obtained by dividing the Total EMPI Matches (TEM) by 2. | DCR = | Total number of individual duplicate patient records x 100
Total Registrations Performed (TRP) | Total EMPI Matches (TEM): The total number of potential pair candidates presented by the EMPI algorithm for a given period of time. A computer generated duplicate report will identify the number of candidate pairs for matches based on the algorithm rules or thresholds. | Total Registrations Performed (TRP): The total number of registration activities (registration, preregistration, scheduling, office visits, among others) performed in a given time period. These activities may vary by organization depending on the registration and scheduling solutions employed as well as their business model. |
| True Match Rate (TMR) | True Match Rate (TMR): The True Match Rate is the ratio of the number of true match pairs (TMP), as determined after manual validation, to the total number of EMPI matching evaluations (TEM) presented by the algorithm plus those identified by other business processes. The formula for computing the TMR is the number of True Match Pairs (TMP) divided by the total number of potential pair candidates (TEM). This figure provides information on the effectiveness of the algorithm in making matches. A low true match rate may indicate that the programmed matching thresholds may need to be fine-tuned or adjusted. | TMR = | True Matched Pairs (TMP) x 100
Total EMPI Matches (TEM) | True Matched Pairs (TMP): The number of pairs generated by the algorithm as well as external business processes that are found, after manual validation, to be confirmed as matched pairs. Sometimes referred to as Adjusted Matched Pairs (AMP). | Total EMPI Matches (TEM): The total number of potential pair candidates presented by the EMPI algorithm for a given period of time. A computer generated duplicate report will identify the number of candidate pairs for matches based on the algorithm rules or thresholds. |
| False Positive Match Rate (FPMR) | False Positive Match Rate (FPMR): Sometimes referred to as False Match Rate or False Positive Rate. The percentage of incorrectly matched candidate pairs over a given period. This measures the percentage of invalid pairs that have been incorrectly paired by the algorithm. The False Match Rate is the incidence of False Matches made by the algorithm that have been confirmed or validated as not being the same individual. It is computed by dividing the number of False Positive Match Pairs (FPMP) by the total number of potential pair candidates (TEM). This figure provides information on the effectiveness of the algorithm in making matches. A high false match rate may indicate that the programmed matching thresholds are too permissive in their matching criteria and may need to be fine-tuned or adjusted. | FPMR = | False Positive Matched Pairs (FPMP) x 100
Total EMPI Matches (TEM) | False Positive Matched Pairs (FPMP): The number of candidate pairs generated by the algorithm that are found, after manual validation, not to be matched pairs. These are sometimes referred to as False Positives or False Matched Pairs. It is the number of incorrect matched pair determinations made by the algorithm in a given period of time. | Total EMPI Matches (TEM): The total number of potential pair candidates presented by the EMPI algorithm for a given period of time. A computer generated duplicate report will identify the number of candidate pairs for matches based on the algorithm rules or thresholds. |
| False Negative (Non-Match) Rate (FNR) | False Negative (NonMatch) Rate (FNR): This reports the percent of incorrect EMPI Non-match decisions made in a given time frame. It is the percentage of candidate pairs who should have been matched but were not. These pairs were discovered during the course of business over a given period of time and were not identified by the algorithm. This measure reflects the matching status or decision after review and validation. This is a manual calculation. It must be pointed out that the FNR result will most probably reflect an incidence of unmatched records much lower than what actually exists in the database. This provides a view of the algorithm effectiveness in discovering matched pairs. Algorithm tuning may be required to reduce the incidence of unmatched pairs. | FNR = | False Negative 'non-match' Pairs (FNMP) x 100
Total EMPI Matches (TEM) | False Negative 'non-match' Pairs (FNMP): The number of incorrect EMPI non-match decisions made in a given period of time. The number of candidate pairs identified by the algorithm thresholds to be non-matches but after manual validation are determined to be matched pairs. These are most often found through normal business processes such as patient, physician, or scheduler report. These are not identified by the algorithm. In other words, this is the number of incorrect EMPI non-match decisions made. This will result in an otherwise unidentified duplicate remaining in the database. This is sometimes called a false negative count or pair. | Total EMPI Non-matches (TENM): Total number of true matches missed by the algorithm and identified during normal operation processes that require additional validation of records. This is a measure of algorithm performance. Note: There is no easy way to capture this but this is a key metric that reflects the accuracy of the algorithm performance. |
| Indeterminate Match Rate (IMR) | Indeterminate Match Rate (IMR): This is also known as ambiguous match rate. Of the total number of evaluations performed by the algorithm (TEM), the percent that were found to be indeterminate matches after validation. These are matches where the pair of candidate records offered by the algorithm did not have sufficient information to make a clear determination of whether or not they were the same individual. This may indicate a number of different factors such as data quality or data capture challenges, business process variation, “old” data that was not adequately managed, or simply business factors that influenced where an organization sets a matching threshold. | IMR = | Indeterminate Match Pair (IMP) x 100
Total EMPI Matches (TEM) | Indeterminate Matched Pairs (IMP): After manual review, the number of algorithm candidate pairs whose identities could not be validated as being the same individual are called an indeterminate match decision. | Total EMPI Matches (TEM): The total number of potential pair candidates presented by the EMPI algorithm for a given period of time. A computer generated duplicate report will identify the number of candidate pairs for matches based on the algorithm rules or thresholds. |
| Matching Accuracy Rate (MAR) | Matching Accuracy Rate (MAR): This is the overall accuracy rate of the demographic matching process over a given period of time. | MAR = | Total Match Pair (TMP) + Total NonMatch Pair (TNMP) x 100
Total EMPI Matches (TEM) | True Matched Pairs (TMP): The number of pairs generated by the algorithm as well as external business processes that are found, after manual validation, to be confirmed as matched pairs. Sometimes referred to as Adjusted Matched Pairs (AMP). | Total EMPI Matches (TEM): The total number of potential pair candidates presented by the EMPI algorithm for a given period of time. A computer generated duplicate report will identify the number of candidate pairs for matches based on the algorithm rules or thresholds. |
| Matching Error Rate (MER) | This is the overall error rate of the demographic matching process over a given period of time. | MER = | False Positive Match Pair (FPMP) + False Positive NonMatch Pair (FNMP) x 100
Total EMPI Matches (TEM)
| False Positive Matched Pairs (FPMP): The number of candidate pairs generated by the algorithm that are found, after manual validation, not to be matched pairs. These are sometimes referred to as False Positives or False Matched Pairs. It is the number of incorrect matched pair determinations made by the algorithm in a given period of time. | Total EMPI Matches (TEM): The total number of potential pair candidates presented by the EMPI algorithm for a given period of time. A computer generated duplicate report will identify the number of candidate pairs for matches based on the algorithm rules or thresholds. |
| Other metrics/performance indicators |
| Metric | Definition | Calculation | Numerator | Denominator |
Precision / PPV
aka Classification Accuracy | The proportion of true matches that were found out of the total matches found. Precision is the number of correct results divided by the number of all returned results.
In other words, it is the number of correct positive results divided by the number of positive results predicted by the classifier. | Precision = | TP
TP + FP | Number of true positives found | Number of total matches found |
Recall
aka Sensitivity | How many from the matches found are real matches or the percent of all relevant documents that is returned by the search.
In other words, it is the number of correct positive results divided by the number of all relevant samples (all samples that should have been identified as positive). | Recall = | TP
TP + FN | Number of true positives found | Number of potential true matches |
| F-1 Score | F1 Score is the harmonic mean between precision and recall. The range for F1 Score is [0, 1]. It tells you how precise your classifier is (how many instances it classifies correctly), as well as how robust it is (it does not miss a significant number of instances).
High precision but lower recall, gives you an extremely accurate, but it then misses a large number of instances that are difficult to classify. The greater the F1 Score, the better is the performance of our model. Mathematically, it can be expressed as : | F = 2 * | Precision * Recall
Precision + Recall | Precision * Recall | Precision + Recall |
| The probability of a correct classification. | (1 – Error) = Pr(C) = | (TP + TN) |
|
|
| (PP + NP) |
| Specificity | The ability of the test to correctly rule out the disease in a disease-free population. | Specificity = | TN |
|
|
| (TN + FP) |
| Logarithmic Loss | Logarithmic Loss or Log Loss, works by penalising false positives. It works well for multi-class classification. When working with Log Loss, the classifier must assign probability to each class for all the samples.
Suppose, there are N samples belonging to M classes, then the Log Loss is calculated: | | where,
y_ij, indicates whether sample i belongs to class j or not
p_ij, indicates the probability of sample i belonging to class j
Log Loss has no upper bound and it exists on the range [0, ∞). Log Loss nearer to 0 indicates higher accuracy, whereas if the Log Loss is away from 0 then it indicates lower accuracy. In general, minimizing Log Loss gives greater accuracy for the classifier. |
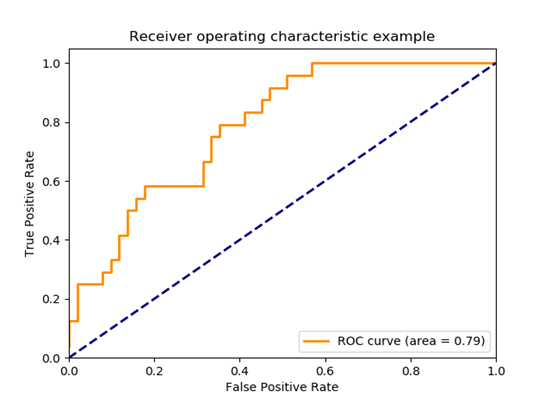
| Area Under Curve | Area Under Curve(AUC) is one of the most widely used metrics for evaluation. It is used for binary classification problem. AUC of a classifier is equal to the probability that the classifier will rank a randomly chosen positive example higher than a randomly chosen negative example. Before defining AUC, let us understand two basic terms :
True Positive Rate (Sensitivity) : True Positive Rate is defined as TP/ (FN+TP). True Positive Rate corresponds to the proportion of positive data points that are correctly considered as positive, with respect to all positive data points.
False Positive Rate (Specificity) : False Positive Rate is defined as FP / (FP+TN). False Positive Rate corresponds to the proportion of negative data points that are mistakenly considered as positive, with respect to all negative data points.
False Positive Rate and True Positive Rate both have values in the range [0, 1]. FPR and TPR bot hare computed at threshold values such as (0.00, 0.02, 0.04, …., 1.00) and a graph is drawn. AUC is the area under the curve of plot False Positive Rate vs True Positive Rate at different points in [0, 1].
As evident, AUC has a range of [0, 1]. The greater the value, the better is the performance of our model. | |
|
| Mean Absolute Error | Mean Absolute Error is the average of the difference between the Original Values and the Predicted Values. It gives us the measure of how far the predictions were from the actual output. However, they don’t gives us any idea of the direction of the error i.e. whether we are under predicting the data or over predicting the data. Mathematically, it is represented as : | | |
|
| Mean Squared Error | Mean Squared Error(MSE) is quite similar to Mean Absolute Error, the only difference being that MSE takes the average of the square of the difference between the original values and the predicted values. The advantage of MSE being that it is easier to compute the gradient, whereas Mean Absolute Error requires complicated linear programming tools to compute the gradient. As, we take square of the error, the effect of larger errors become more pronounced then smaller error, hence the model can now focus more on the larger errors. | | |
|